
SYLLABUS
GS-3: Indian Economy and issues relating to planning, mobilization of resources, growth, development and employment.
Context: Recently, the Ministry of Statistics & Programme Implementation released the Periodic Labour Force Survey (PLFS) Annual Report 2025 (January–December 2025).
Background and Objectives of PLFS
• The PLFS was launched in 2017 by the NSO.
• It is the primary source of statistics on labour force, employment, and unemployment in India.
• It was designed to:
- Generating quarterly estimates of key employment and unemployment indicators for urban areas using the CWS, and
- Providing annual estimates of these indicators in both Usual Status (ps+ss) and CWS for both rural and urban areas.
• Previously, the labour force survey was released on a quarterly and annual basis.
• Previous Releases:
- Quarterly Bulletins: 25 Bulletins released covering the period from December 2018 to December 2024.
- Annual Reports: 7 Annual Reports released covering July 2017 to June 2024, with data for both rural and urban areas.
Revamped PLFS from January 2025
• To meet the demand for high-frequency labour market data, the PLFS sampling design was revamped in January 2025 to enhance the frequency, scope, and relevance of labour force estimates.
• The key objectives of this revamped design include:
- Monthly estimation of key labour market indicators, LFPR, WPR, and UR, for both rural and urban areas, using the CWS at the all-India level.
- Expansion of quarterly PLFS results to include rural areas, thereby producing combined rural and urban estimates under the CWS framework.
- Annual estimates of employment and unemployment indicators using both Usual Status (ps+ss) and CWS for rural and urban populations.
• New Sampling Design:
- A new rotational panel sampling design has been introduced for both rural and urban areas.
- The rotational panel is of 2-year duration, after which the sampling frame is updated.
- Each selected household is visited four times across four consecutive months.
- The first visit follows the original schedule.
- The next three are revisits based on a predefined revisit schedule.
- 75% of First-Stage Sampling Units (FSUs) are retained across two consecutive months. This ensures continuity and comparability in estimates from month to month.
- This structure allows for tracking short-term labour market dynamics and increases the survey’s responsiveness to economic shocks or seasonal variations.
Key Highlights of PLFS, Annual Report 2025
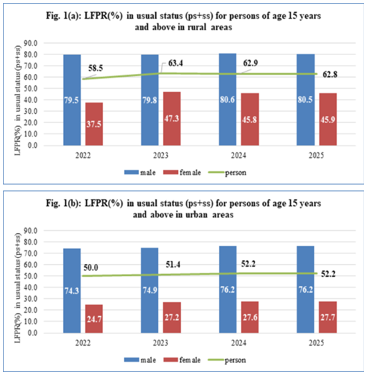
• Labour Force Indicators: The LFPR for persons aged 15 years and above was estimated at 59.3% in 2025.
- The LFPR for males and females stood at 79.1% and 40.0%, respectively.
- The WPR for persons aged 15 years and above was estimated at 57.4%.
- The WPR for males and females stood at 76.6% and 38.8%, respectively.
- The rural labour force participation remained strong, with rural male LFPR at 80.5% and rural female LFPR at 45.9%, while urban levels remained broadly stable.
• Unemployment Trends: The unemployment rate (UR) for persons aged 15 years and above was 3.1% in 2025.
- The male UR declined slightly from 3.3% in 2024 to 3.1% in 2025, while the female UR remained unchanged.
- The rural unemployment rate stood at 2.4%, while the urban unemployment rate was higher at 4.8%.
- The youth unemployment rate (15–29 years) declined from 10.3% in 2024 to 9.9% in 2025.
- The rural youth unemployment rate declined to 8.3%, while the urban youth unemployment rate declined to 13.6%.
• Employment Structure: The share of self-employed workers declined from 57.5% in 2024 to 56.2% in 2025.
- The share of workers in regular wage/salaried employment increased to 23.6% in 2025.
- The share of workers engaged in casual labour remained broadly stable at around 20%.
• Sectoral Composition: The share of employment in agriculture declined from 44.8% in 2024 to 43.0% in 2025.
- The share of employment in manufacturing increased from 11.6% to 12.1%.
- The share of employment in services increased from 12.2% to 13.1%.
• Gender Dimensions: Among females, 44.4% reported childcare and domestic responsibilities as the main reason for not participating in the labour force.
- Among males, 69.8% reported education as the main reason for not being in the labour force.
- Male workers worked more hours per week than female workers across self-employment, salaried employment and casual labour.
- Although female wages recorded higher growth, their absolute earnings remained lower than those of male workers.
• Education and Skills: The average number of years of formal education for persons aged 15 years and above was estimated at 10.0 years.
- For persons aged 25 years and above, the average years of schooling was 9.8 years.
- About 67.8% of the population had attained at least secondary education. This proportion was higher in urban areas (79.7%) compared to rural areas (61.9%).
- Only 4.2% of persons aged 15–59 years had received formal vocational or technical training.
- Among those who received formal training, workforce participation was higher for males (83.3%) compared to females (51.4%).
• NEET and Workforce Size: About 25.0% of persons aged 15–29 years were not in employment, education or training (NEET).
- The total number of employed persons aged 15 years and above was estimated at 61.6 crore. This included 41.6 crore males and 20.0 crore females.
Sources:
PIB