
SYLLABUS
GS-3: Conservation, environmental pollution and degradation, environmental impact assessment.
Context: The 2025 World Air Quality Report finds that despite India’s PM2.5 levels declining to a three-year low, it remains one of the most polluted countries in the world.
Key Findings of the Report
Global Trends:
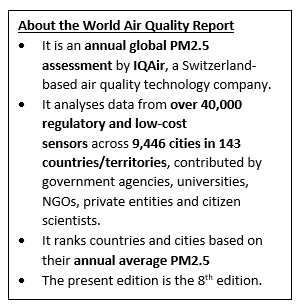
- Pakistan is the world’s most polluted country, followed by Bangladesh, Tajikistan, Chad and the Democratic Republic of Congo.
- Central & South Asia remains the worst-affected region.
- Only 13 countries/territories (including French Polynesia, Puerto Rico, Iceland, Australia, Estonia) met the WHO annual PM2.5 guideline.
- Only 14% of global cities met the WHO guideline in 2025, down from 17% in 2024, with worsening air linked in part to wildfires and climate change.
India‑Specific Findings:
- India’s particulate matter (PM2.5) concentrations were at a three-year low, though it is still the sixth most polluted country in the world.
- In 2023, India ranked 3rd globally, behind only Bangladesh and Pakistan, while in 2024, it was ranked 5th.
- India’s population-weighted annual average PM2.5 concentration in 2025 was 48.9 µg/m³, a 3% decrease from 2024 (50.6 µg/m³) and a 10% decrease from 2023 (54.4 µg/m³), but it remains nearly 10 times the WHO guideline of 5 µg/m³.
- Loni (Uttar Pradesh) is reported as the most polluted city globally, with annual PM2.5 above 112 µg/m³, followed closely by Hotan (China) and Byrnihat (Meghalaya).
- Delhi ranks among the top five polluted cities and remains the most polluted capital city globally.
- The report notes that 74 of the 100 most polluted cities in 2024 were in India.
About Particulate Matter
- It is a complex mixture of tiny solid particles and liquid droplets suspended in air.
- PM is classified on the basis of both emission and size.
- Classification on the basis of emission:
- Primary PM: PM is called primary if it is directly emitted into the atmosphere in its particulate form. Examples include wind-blown dust such as road dust, fly ash, soot, etc.
- Secondary PM: PM is called secondary if it is formed by chemical reactions in the atmosphere. Examples include sulphates, nitrates, etc.
- Classification on the basis of size:
- PM10: Particles that are 10 micrometres or smaller in diameter. These particles are small enough to be inhaled into the lungs but are usually filtered by the nose and throat.
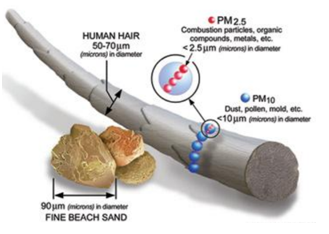
- PM2.5: Finer particles that are 2.5 micrometres or smaller. Therefore, PM2.5 is a subset of PM10. These can penetrate deep into the lungs and even enter the bloodstream, making them more harmful to health.
- The WHO guideline for annual average PM2.5 is 5 µg/m³, while for PM10 it is 15 µg/m3.
Impacts of PM Pollution
- Health Impact: Causes respiratory and cardiovascular diseases; PM2.5 can penetrate the lungs and bloodstream, leading to premature deaths.
- Environmental Impact: Leads to smog formation, reduces visibility, and harms crops and ecosystems.
- Economic Impact: Increases healthcare costs and reduces labour productivity.
- Social Impact: Disproportionately affects vulnerable groups (children, elderly, poor), worsening inequality.
- Urban Livability Impact: Degrades quality of life in cities, affecting tourism, migration patterns, and overall well-being.
Initiatives Taken by the Government to Curb PM Pollution
- National Clean Air Programme (NCAP): Launched by the Ministry of Environment, Forest and Climate Change (MoEF&CC) in January 2019, it aims to improve air quality in 131 non-attainment cities by reducing PM pollution by up to 40% over the 2017 baseline year.
- National Air Quality Index (AQI): Launched by MoEF&CC in October 2014, as ‘One Number – One Colour – One Description’, it transforms the complex air quality data of eight pollutants into a single number (index value), nomenclature and colour for effective dissemination of air quality information to common people.
- System of Air Quality and Weather Forecasting and Research (SAFAR): Launched by the Ministry of Earth Sciences for greater metropolitan cities, it provides real-time air quality data and 1–3 day forecasts for advance planning of pollution-control actions.
- Graded Response Action Plan (GRAP): Implemented in Delhi-NCR since 2017, GRAP is an emergency response tool activated when pollution levels cross set thresholds. It prescribes tiered measures based on AQI levels, such as bans on diesel generators, construction, and entry of trucks, etc.
- Commission for Air Quality Management (CAQM): Constituted in October 2020 as a statutory authority, CAQM is responsible for planning, coordinating, and supervising air quality management in Delhi-NCR and adjoining areas.
- Bharat Stage (BS) Emission Norms: Modelled after European emission standards, BS norms limit the release of pollutants from vehicles. In April 2020, India skipped BS5 norms and transitioned directly to BS6 to align India’s emission standards with global benchmarks and drastically cut PM and NOx emissions.
Source:
Thehindu
Deccanherald