
SYLLABUS
GS-2: Issues relating to poverty and hunger.
GS-3: Inclusive growth and issues arising from it.
Context: According to the World Bank’s October 2026 Poverty and Equity Brief, India’s poverty rate declined from 57.7% in 2011 to 16.1% in 2023, lifting an estimated 49.6 crore people above the lower-middle-income poverty threshold.
About the World Bank’s Poverty and Equity Brief
- The Poverty and Equity Brief (PEB) is published by the World Bank twice a year, during its Spring and Annual Meetings with the International Monetary Fund (IMF).
- It provides a country-wise overview of poverty, shared prosperity and inequality trends across more than 100 developing countries.
- It presents key indicators covering monetary poverty, multidimensional poverty, poverty levels and income inequality.
- It uses internationally comparable poverty thresholds based on Purchasing Power Parity (PPP):
- $3.00/day: International Extreme Poverty Line.
- $4.20/day: Lower-Middle-Income Country Poverty Line.
- $8.30/day: Upper-Middle-Income Country Poverty Line.
- It also uses the Multidimensional Poverty Measure (MPM) and Gini Index to assess non-monetary deprivation and income inequality.
Key Findings of the World Bank’s Poverty and Equity Brief
- Decline in Poverty:
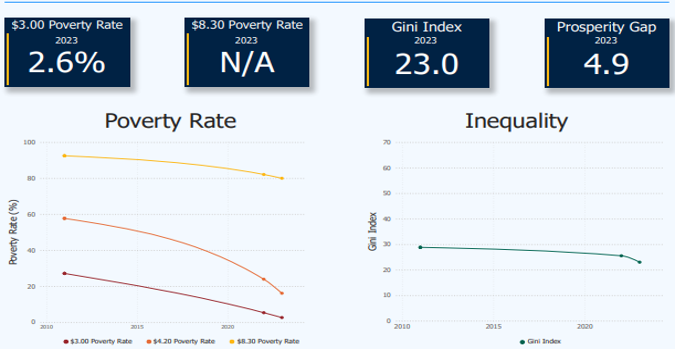
- Lower-middle-income poverty ($4.20/day): Fell from 57.7% (2011) to 16.1% (2023), lifting 49.6 crore people above the poverty threshold.
- Extreme poverty ($3/day): Declined from 27.1% to 2.6% during 2011–2023.
- Upper-middle-income poverty ($8.30/day): 80% of India’s population remained below this threshold in 2023.
- India recorded one of the fastest poverty reductions globally.
- Reduction in Multidimensional Poverty: OPHI’s MPI-based poverty declined from 53.8% (2005–06) to 16.4% (2019–21).
- World Bank’s Multidimensional Poverty Measure stood at 15.5% (2022–23).
- Major Drivers of Poverty Reduction: Rising consumption, household incomes and employment, particularly among rural women.
- Expanded social transfers, including food subsidies.
- Electricity access reached 99% of the population in 2022.
- Employment and Labour Market Trends: Employment increased by 13.4 crore (2017–2023), nearly twice the growth of the working-age population.
- Rural women entering paid employment contributed significantly to this growth.
- Youth unemployment rose from 14.6% to 15.9% between Q1 FY2026 and Q1 FY2027, particularly among rural young women.
- Real earnings remained broadly unchanged, with employment concentrated in low-productivity activities.
- Wage Inequality and Vulnerable Households: Median earnings of the top 10% of workers were 13 times those of the bottom 10% in 2023.
- India’s Gini Index stood at 23.0 in 2023.
- Poverty is increasingly concentrated among households with lower education, fewer assets, limited access to stable employment and higher dependency ratios.
- Regional and Social Distribution of Poverty:
- Rural–urban poverty: 19.3% in rural areas against 8.6% in urban areas (2023).
- Educational attainment: Poverty was 21.3% among people aged 16+ without education, compared with 7.4% among those with tertiary/post-secondary education.
- Rural India recorded faster poverty reduction, narrowing the rural–urban poverty gap.
- The geographical belt from Uttar Pradesh to West Bengal accounts for 57% of India’s poor population.
- Future Poverty Projections: Poverty at the $4.20/day threshold is projected to decline:
- 2026: 14.2%.
- 2028: 12.1%.
- These are indicative microsimulation-based projections subject to revision as new labour-market and economic data become available.